Plot Method for 'rma' Objects
plot.rma.RdFunctions to plot objects of class "rma.uni", "rma.mh", "rma.peto", and "rma.glmm".
# S3 method for class 'rma.uni'
plot(x, qqplot=FALSE, ...)

# S3 method for class 'rma.mh'
plot(x, qqplot=FALSE, ...)

# S3 method for class 'rma.peto'
plot(x, qqplot=FALSE, ...)

# S3 method for class 'rma.glmm'
plot(x, qqplot=FALSE, ...) # not currently implemented

# S3 method for class 'rma.mv'
plot(x, qqplot=FALSE, ...) # not currently implemented
Arguments
Details
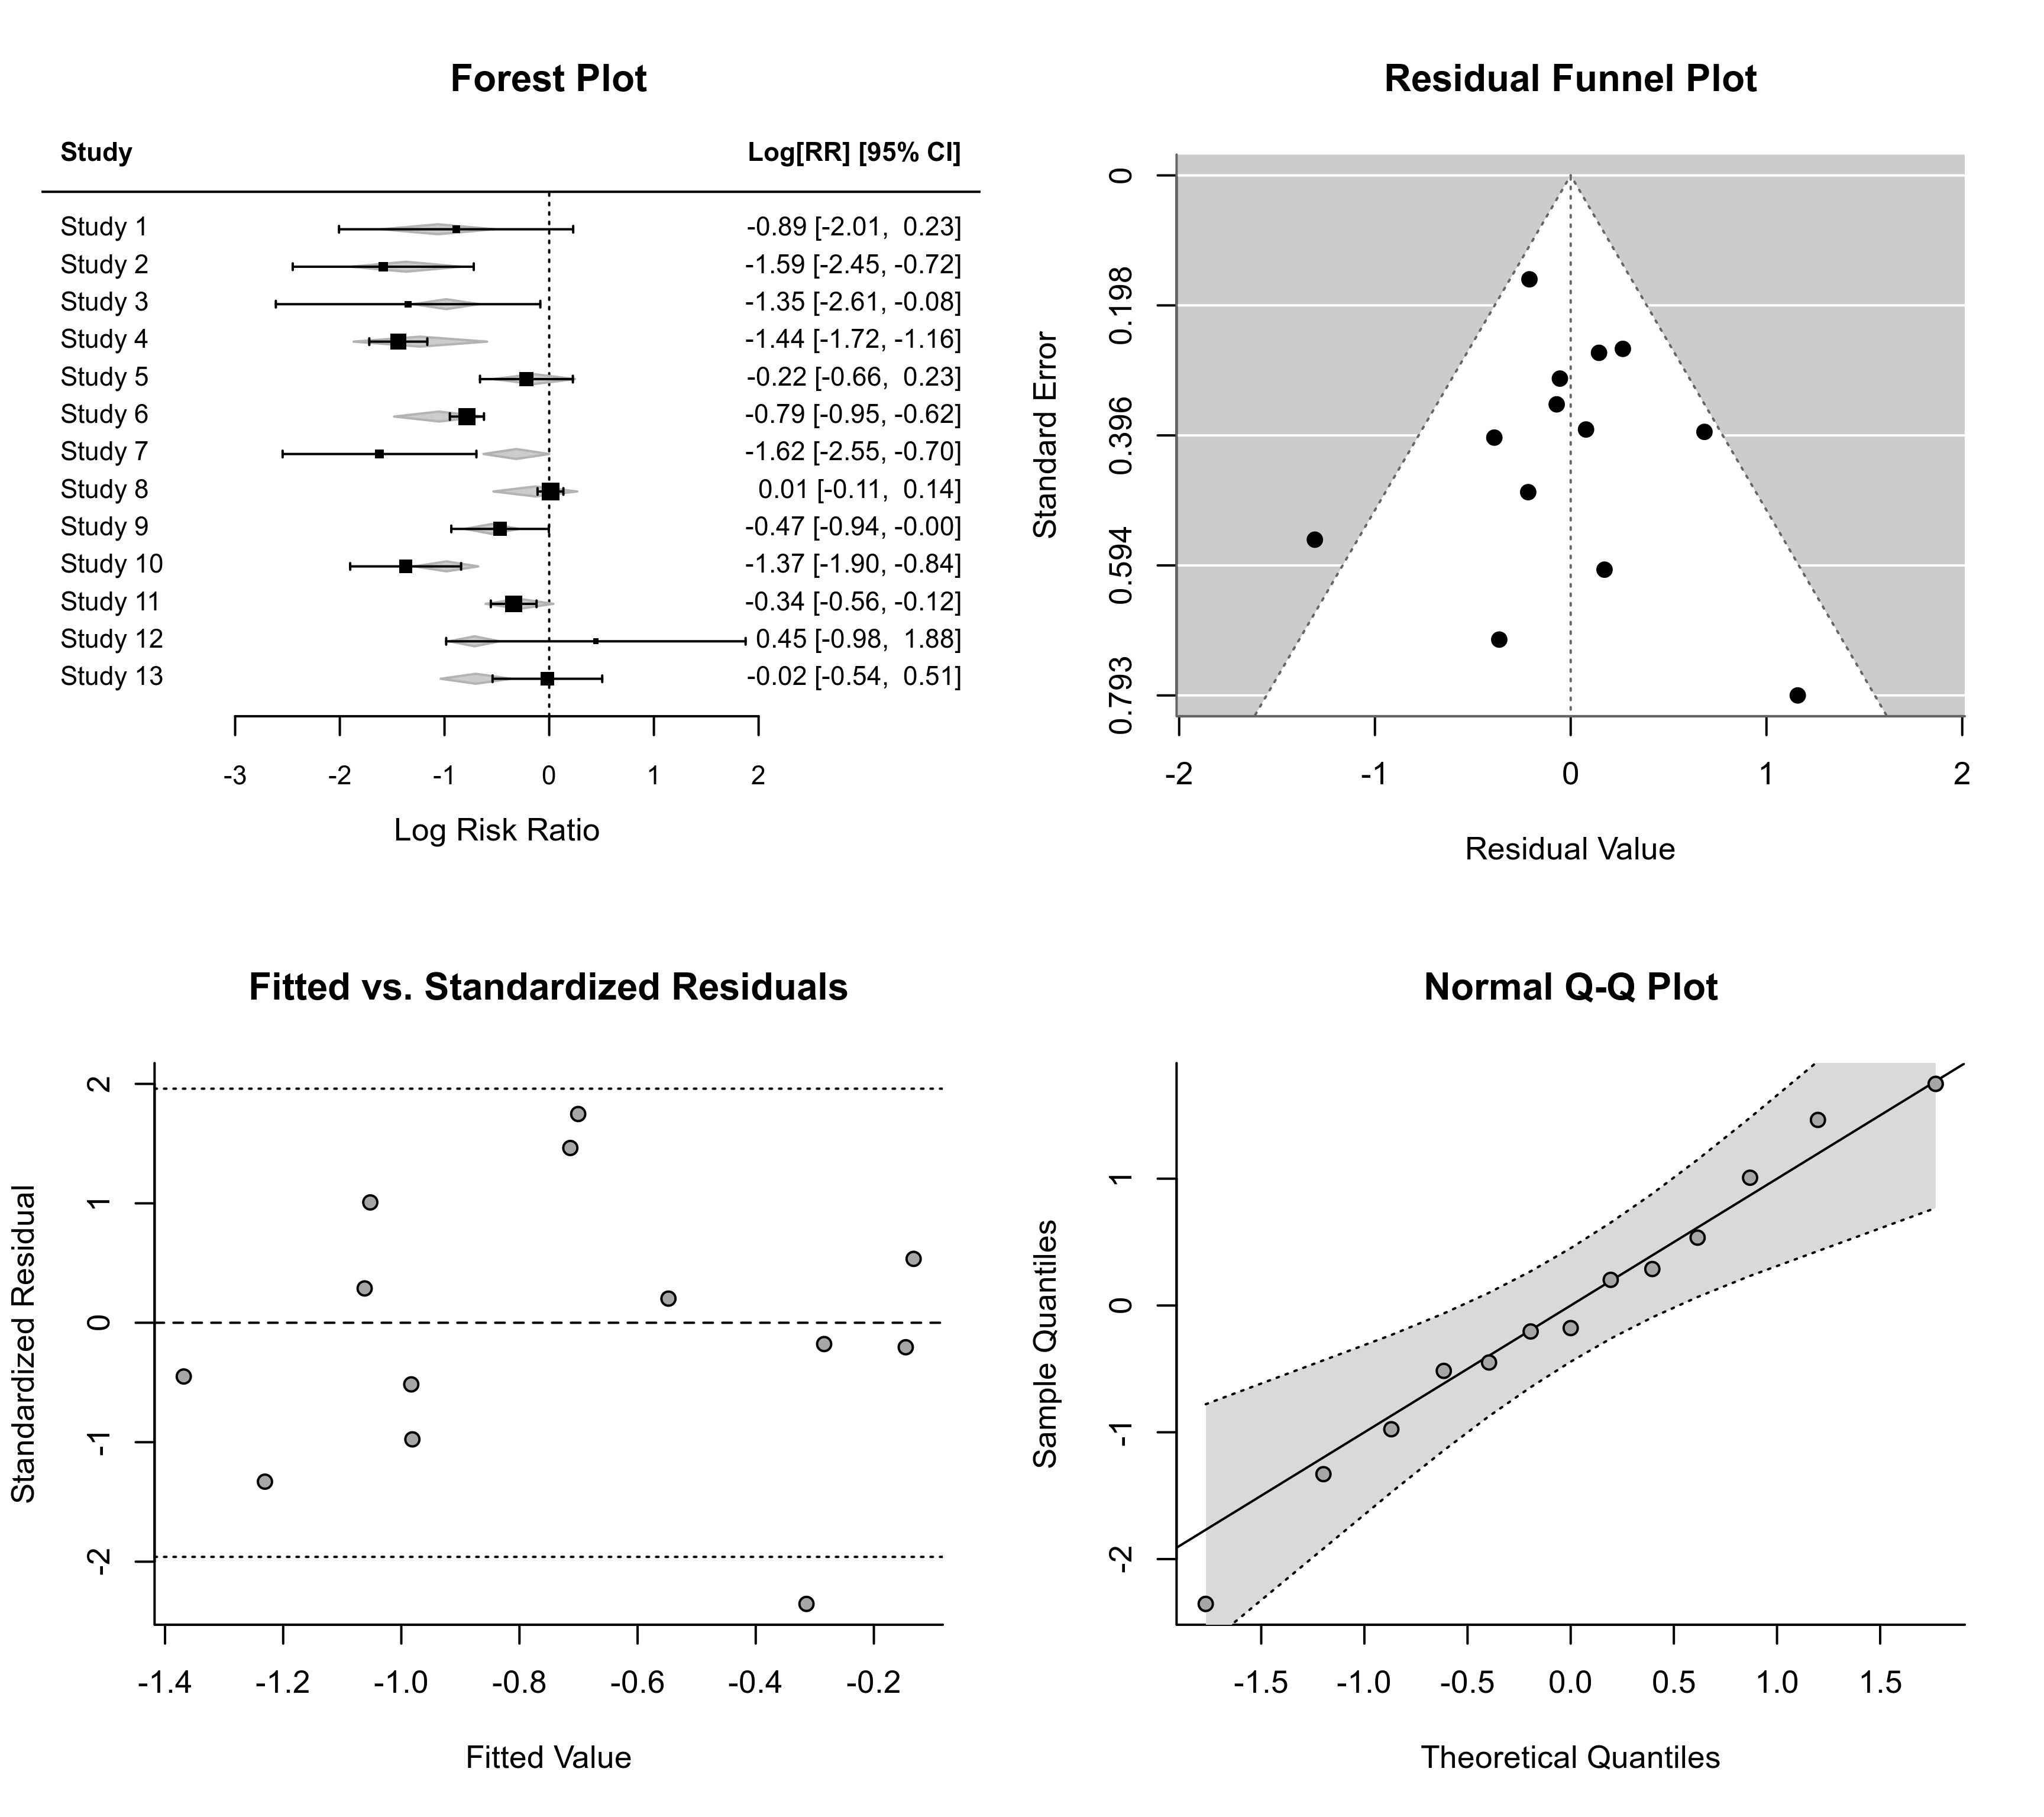
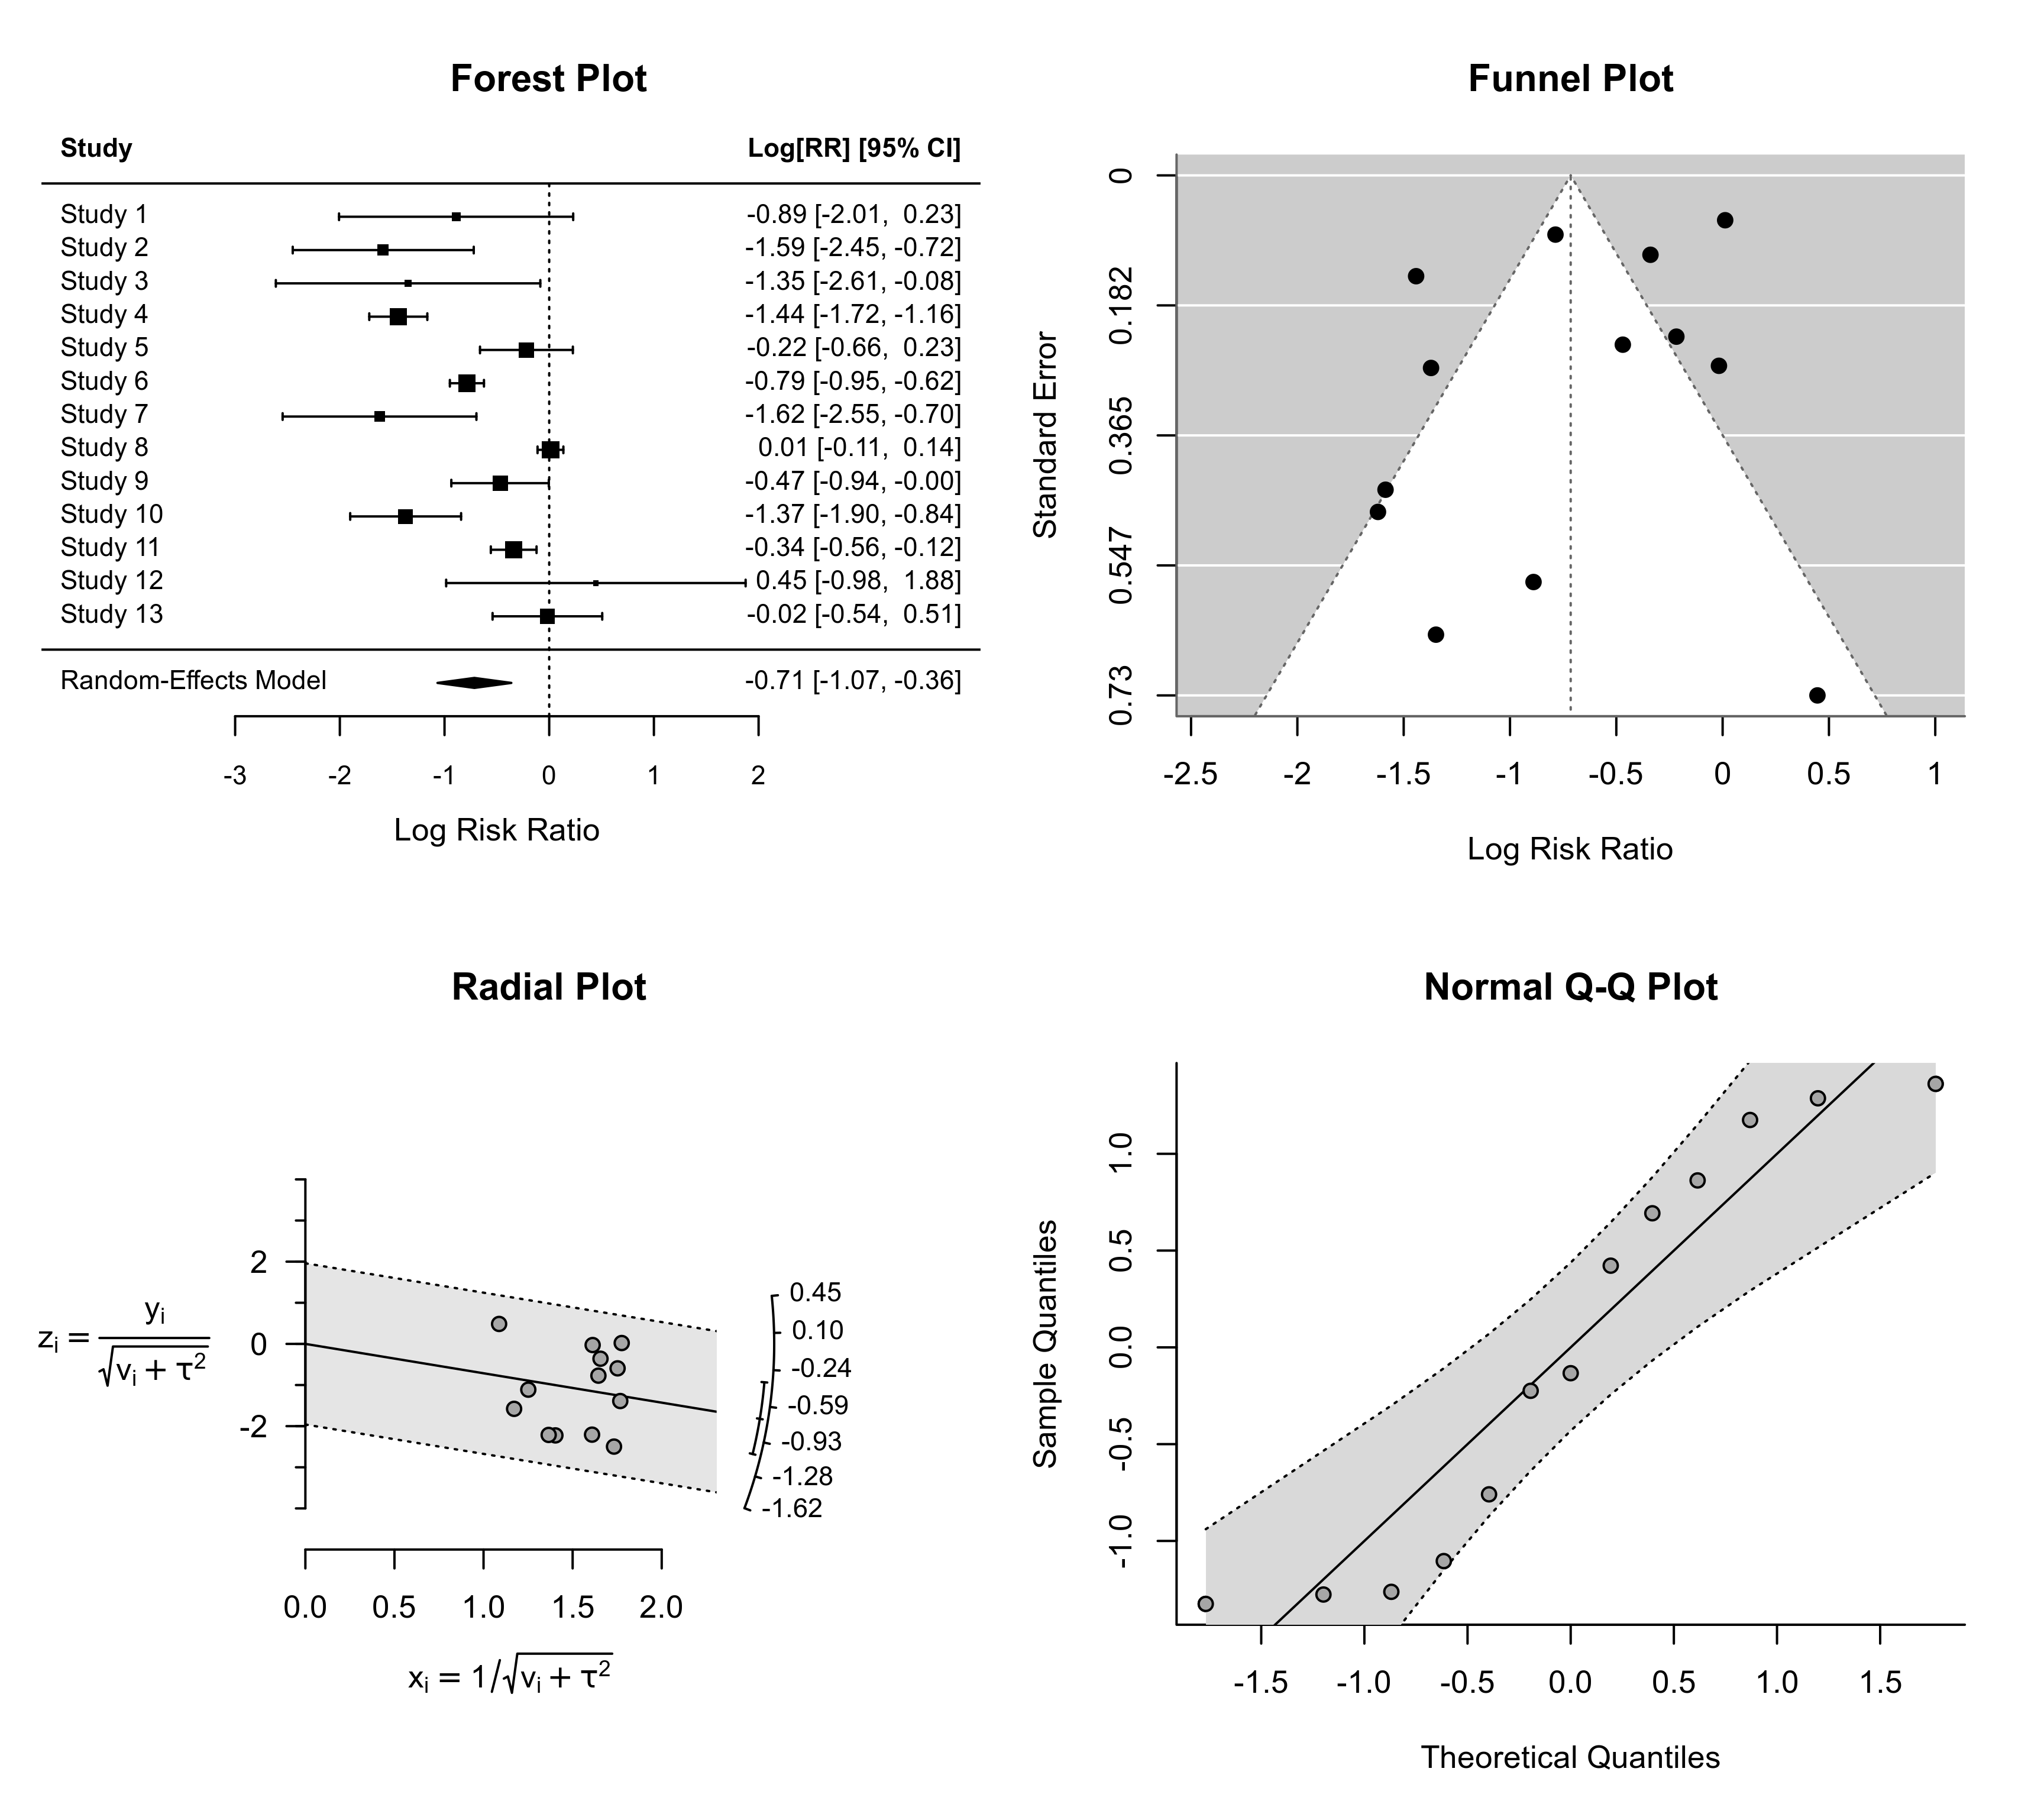
Four plots are produced. If the model does not contain any moderators, then a forest plot, funnel plot, radial plot, and a plot of the standardized residuals is provided. If qqplot=TRUE, the last plot is replaced by a normal QQ plot of the standardized residuals.
If the model contains moderators, then a forest plot, funnel plot, plot of the standardized residuals against the fitted values, and a plot of the standardized residuals is provided. If qqplot=TRUE, the last plot is replaced by a normal QQ plot of the standardized residuals.
Note
If the number of studies is large, the forest plot may become difficult to read due to the small font size. Stretching the plotting device vertically should provide more space.
References
Viechtbauer, W. (2010). Conducting meta-analyses in R with the metafor package. Journal of Statistical Software, 36(3), 1–48. https://doi.org/10.18637/jss.v036.i03
See also
Examples
### calculate log risk ratios and corresponding sampling variances
dat <- escalc(measure="RR", ai=tpos, bi=tneg, ci=cpos, di=cneg, data=dat.bcg)

### fit random-effects model
res <- rma(yi, vi, data=dat)

### plot results
plot(res, qqplot=TRUE)


### fit mixed-effects model with absolute latitude and publication year as moderators
res <- rma(yi, vi, mods = ~ ablat + year, data=dat)

### plot results
plot(res, qqplot=TRUE)
### fit mixed-effects model with absolute latitude and publication year as moderators
res <- rma(yi, vi, mods = ~ ablat + year, data=dat)
### plot results
plot(res, qqplot=TRUE)