Plot Method for 'cumul.rma' Objects
plot.cumul.rma.RdFunction to plot objects of class "cumul.rma".
# S3 method for class 'cumul.rma'
plot(x, yaxis, xlim, ylim, xlab, ylab,
     at, transf, atransf, targs, digits, cols,
     grid=TRUE, pch=19, cex=1, lwd=2, ...)
Arguments
- x
an object of class
"cumul.rma"obtained withcumul.- yaxis
either
"tau2","I2", or"H2"to specify what values should be placed on the y-axis. See ‘Details’.- xlim
x-axis limits. If unspecified, the function sets the x-axis limits to some sensible values.
- ylim
y-axis limits. If unspecified, the function sets the y-axis limits to some sensible values.
- xlab
title for the x-axis. If unspecified, the function sets an appropriate axis title.
- ylab
title for the y-axis. If unspecified, the function sets an appropriate axis title.
- at
position of the x-axis tick marks and corresponding labels. If unspecified, the function sets the tick mark positions/labels to some sensible values.
- transf
optional argument to specify a function to transform the pooled estimates (e.g.,
transf=exp; see also transf). If unspecified, no transformation is used.- atransf
optional argument to specify a function to transform the x-axis labels (e.g.,
atransf=exp; see also transf). If unspecified, no transformation is used.- targs
optional arguments needed by the function specified via
transforatransf.- digits
optional integer to specify the number of decimal places to which the tick mark labels of the x- and y-axis should be rounded. Can also be a vector of two integers, the first to specify the number of decimal places for the x-axis, the second for the y-axis labels (e.g.,
digits=c(2,3)). If unspecified, the function tries to set the argument to some sensible values.- cols
vector with two or more colors for visualizing the order of the cumulative results.
- grid
logical to specify whether a grid should be added to the plot. Can also be a color name.
- pch
plotting symbol to use. By default, a filled circle is used. See
pointsfor other options.- cex
symbol expansion factor.
- lwd
line width.
- ...
other arguments.
Details
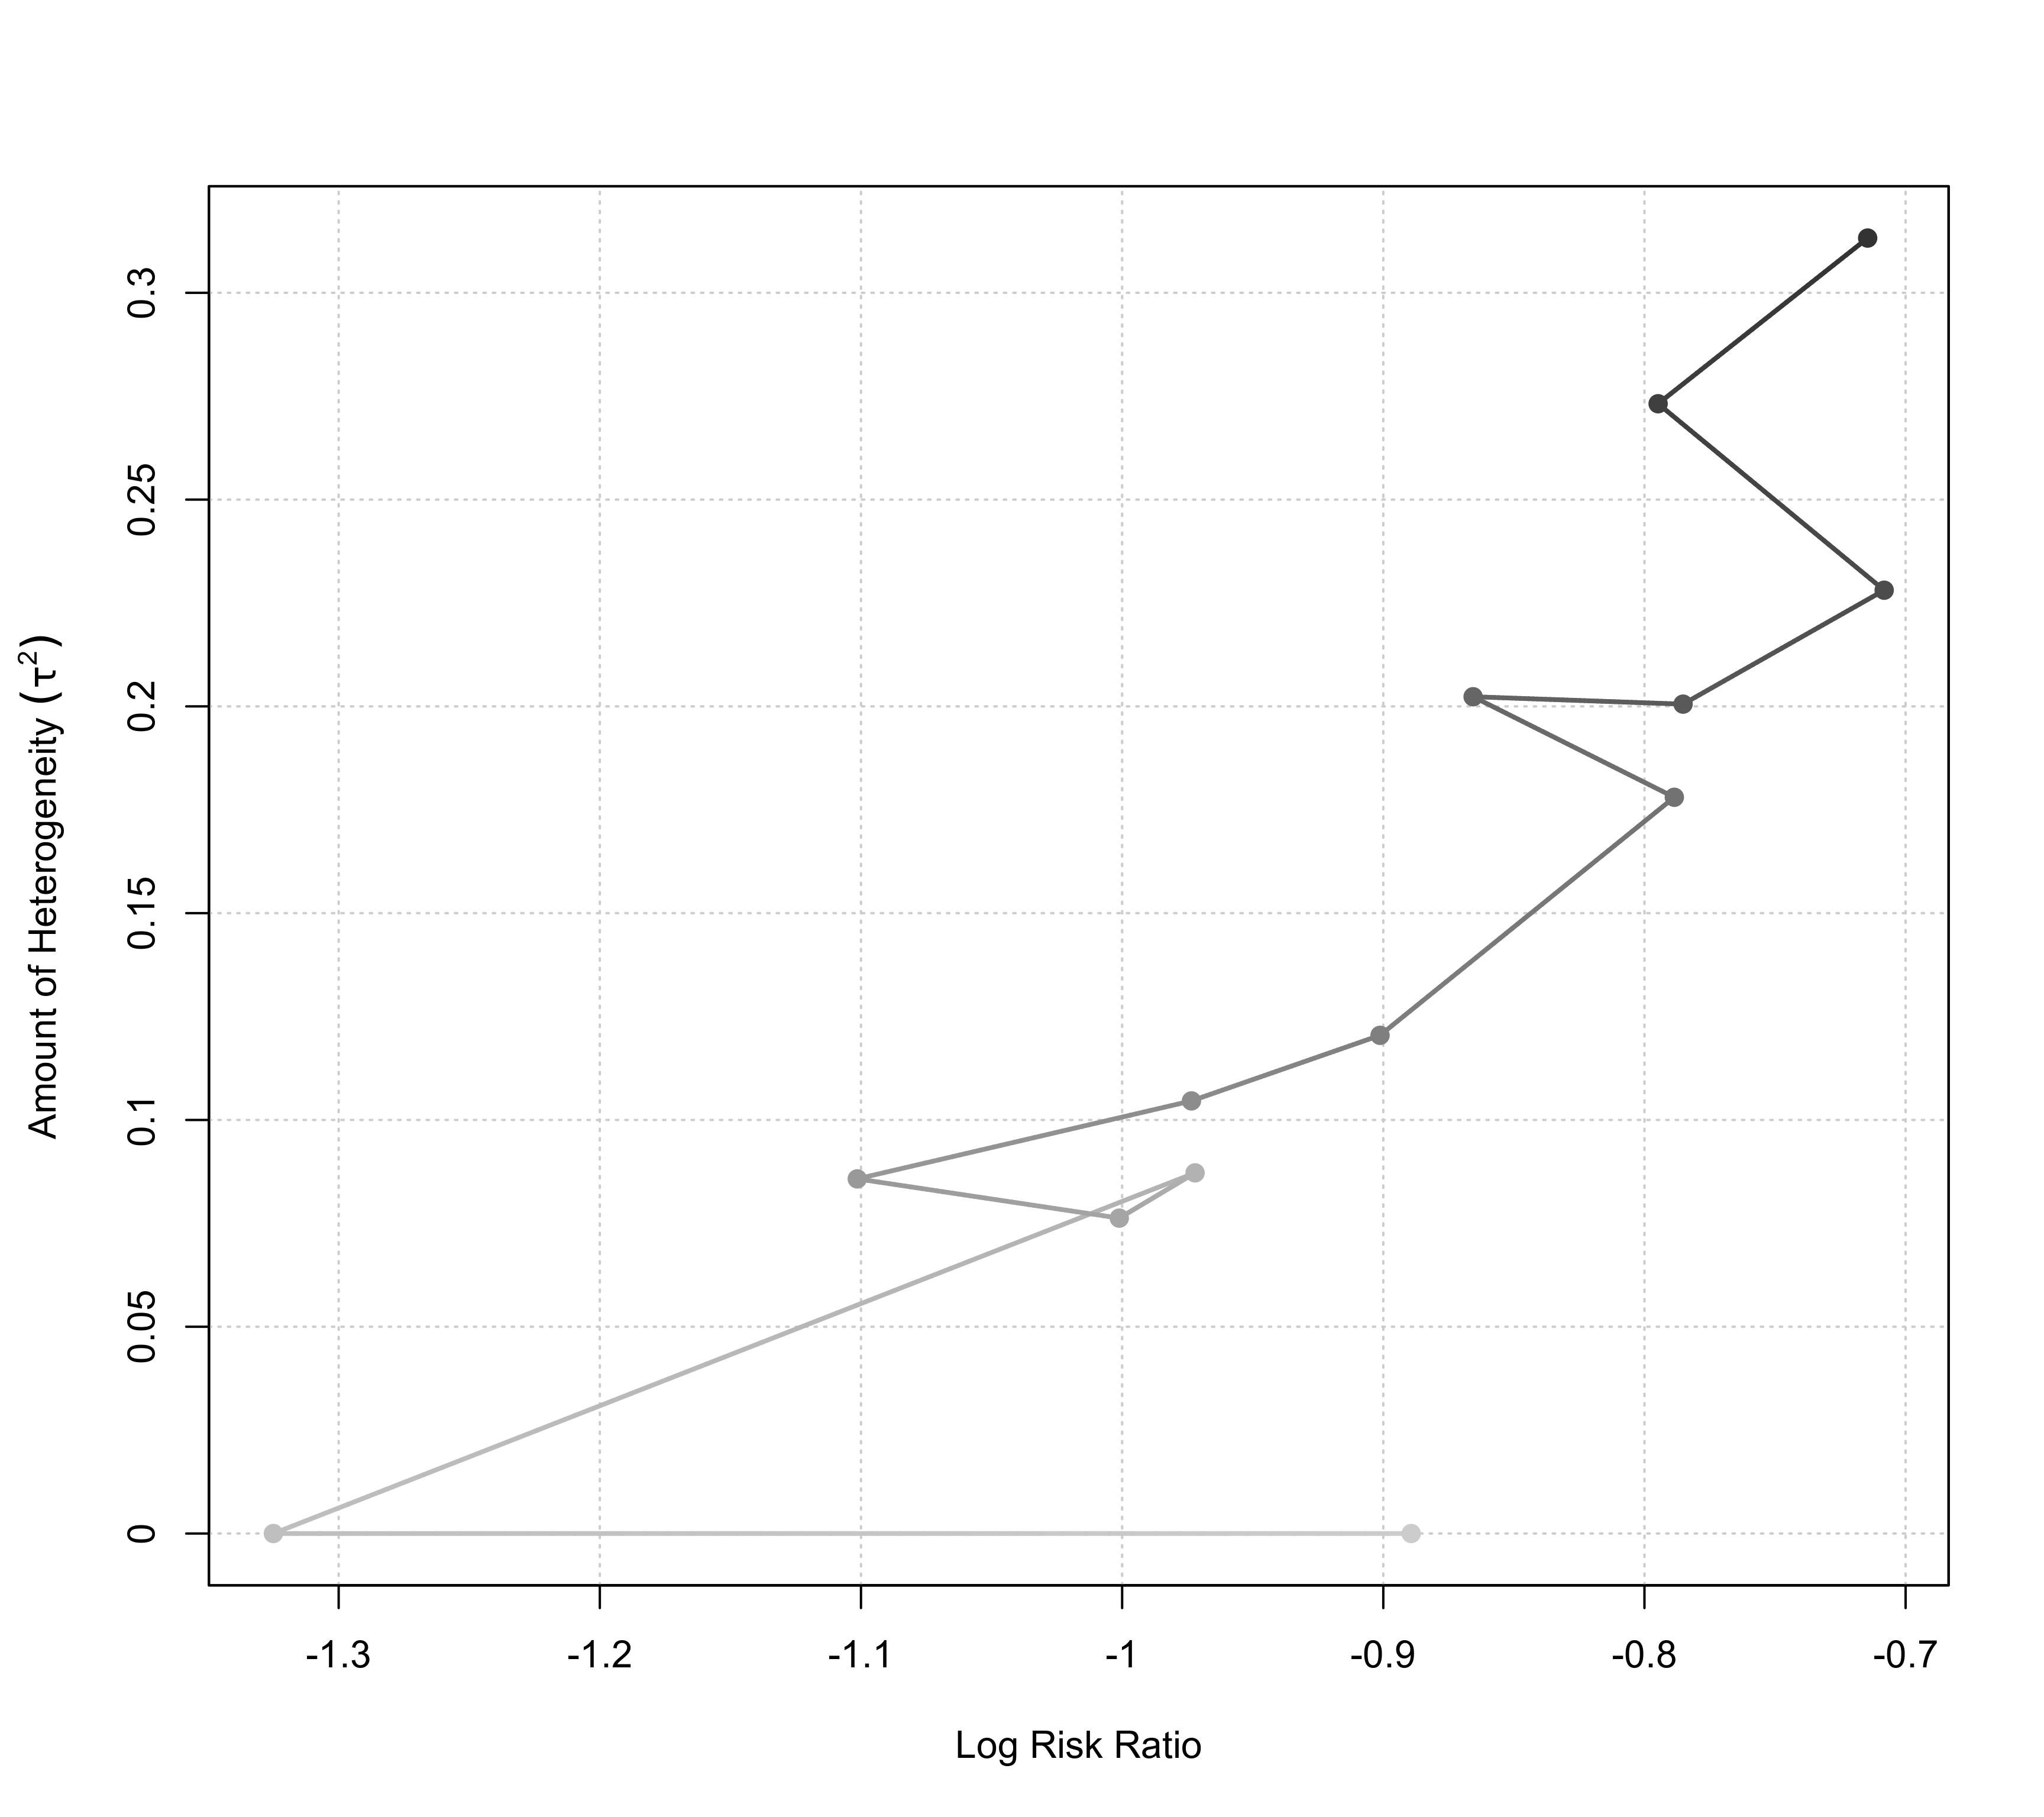
The function can be used to visualize the results from a cumulative meta-analysis as obtained with the cumul function.
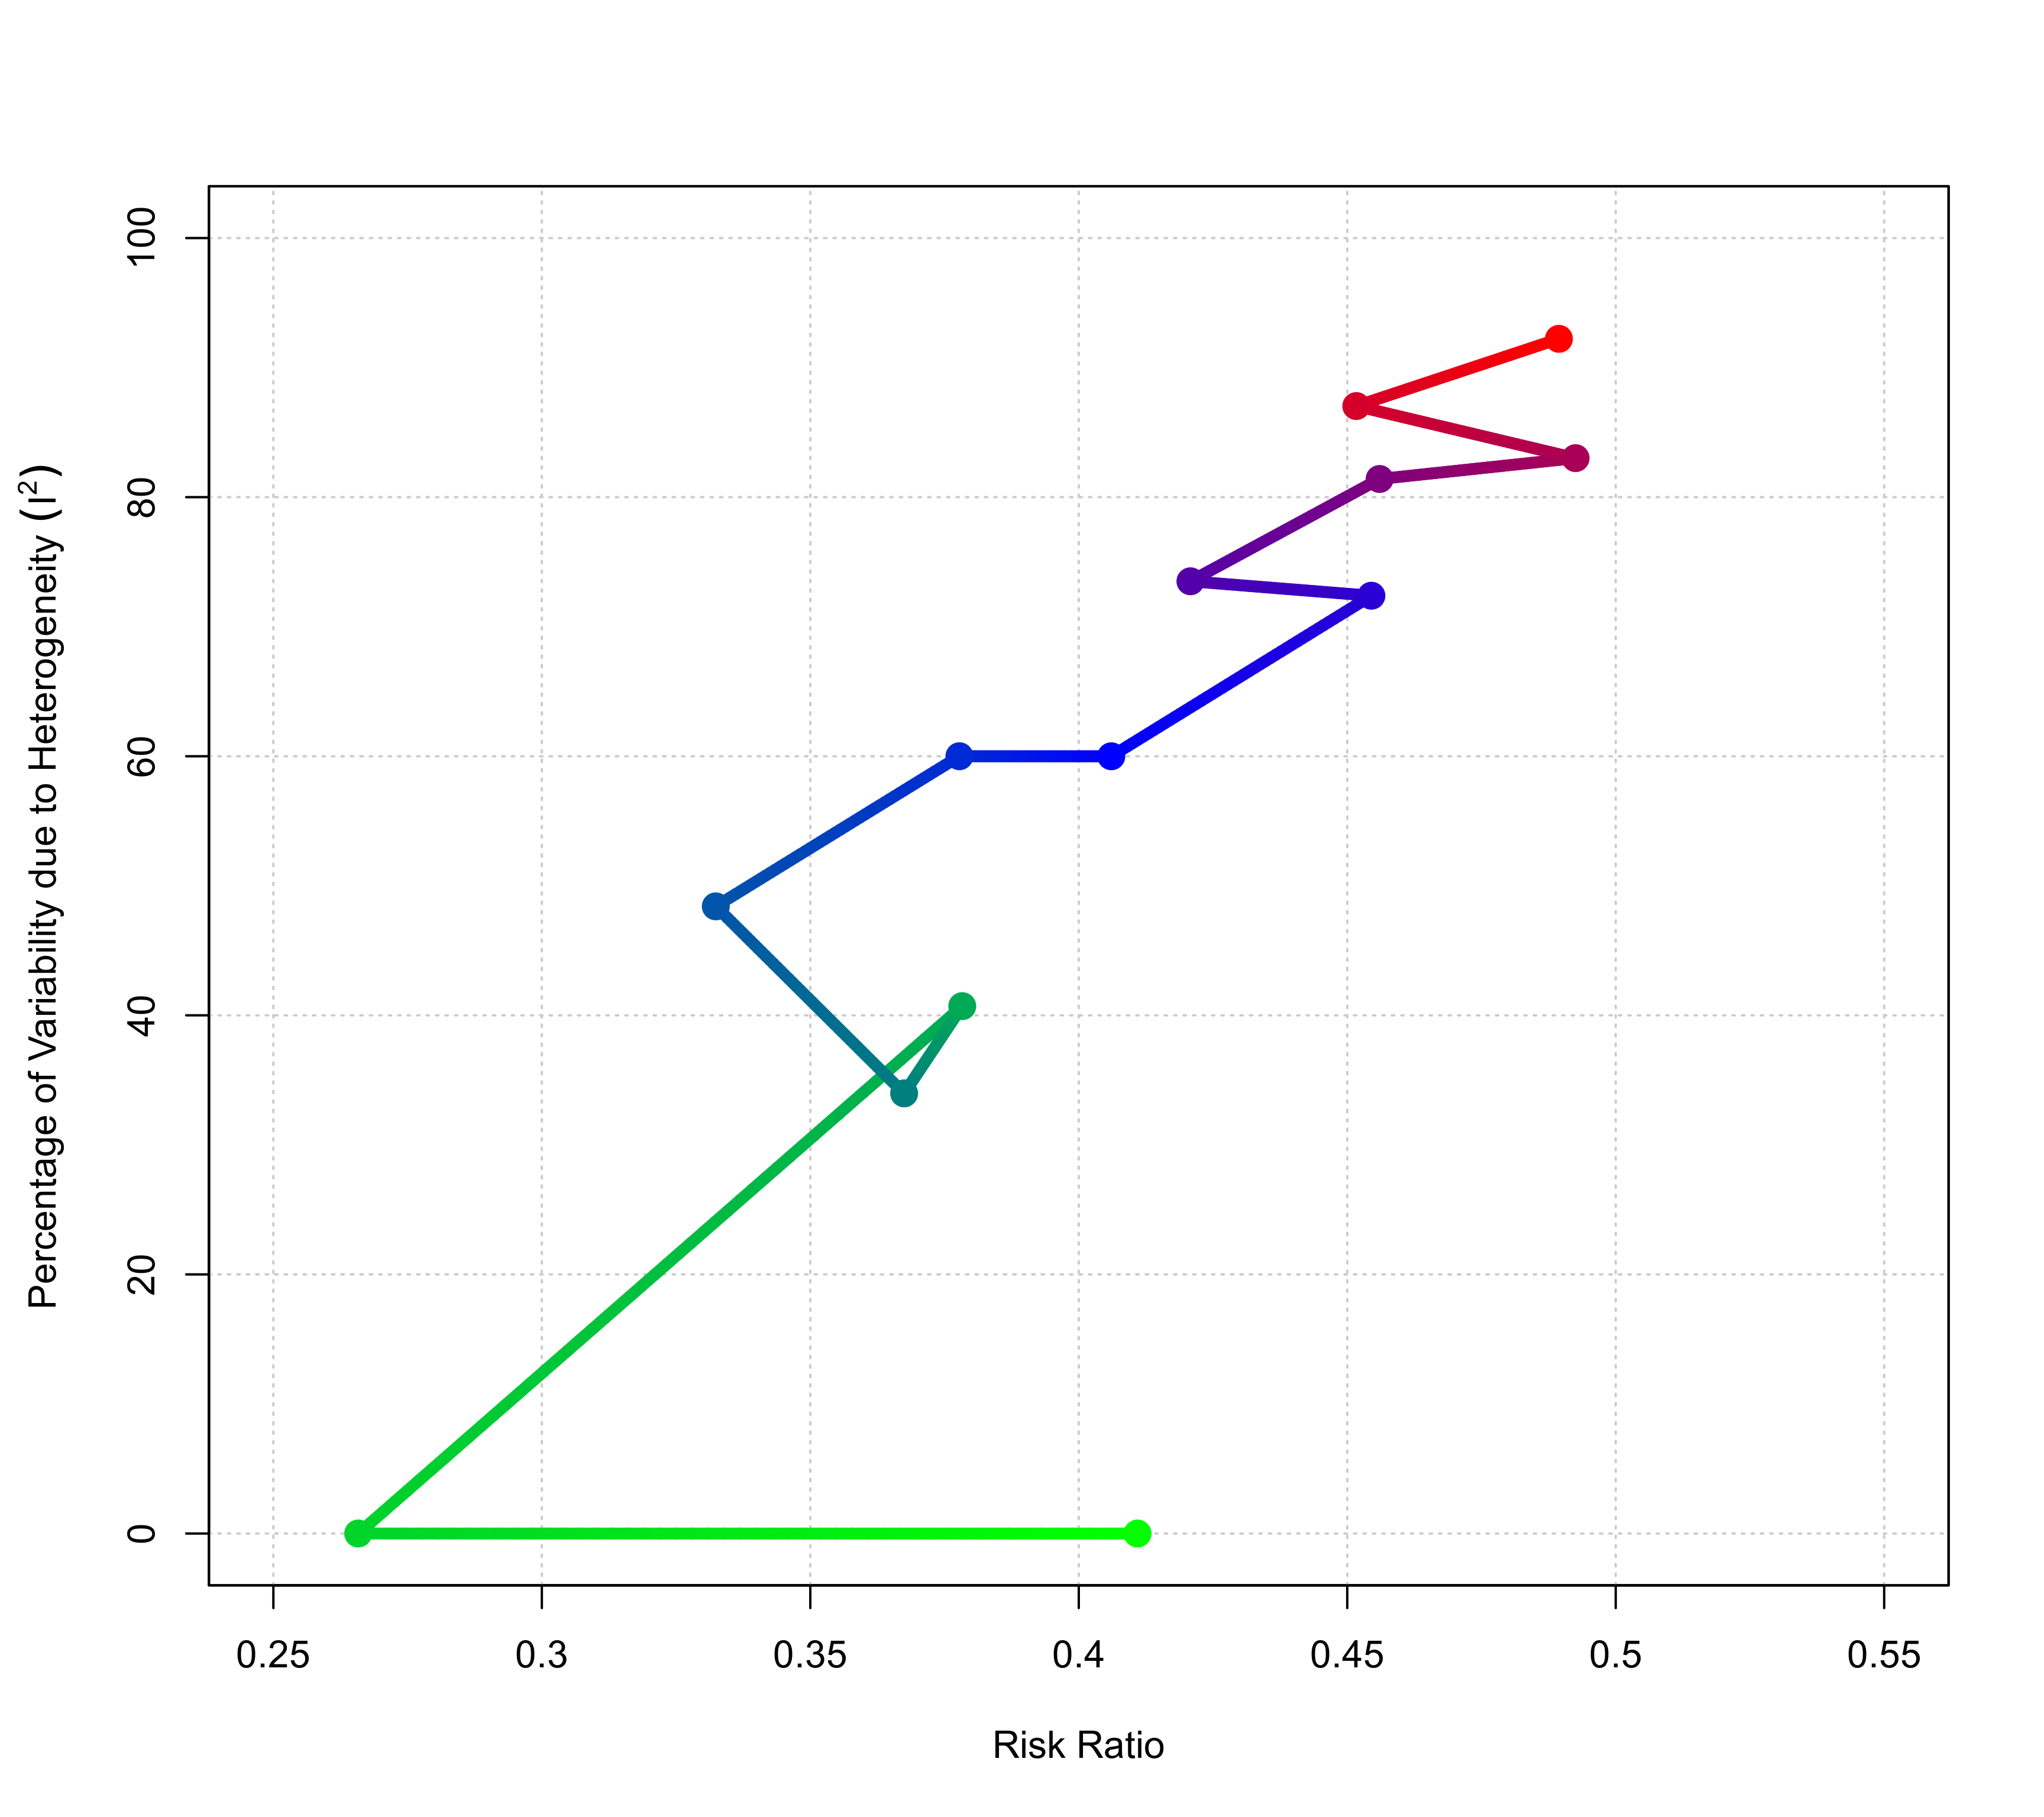
The plot shows the pooled estimate on the x-axis and some measure of heterogeneity on the y-axis in the cumulative order of the results in the "cumul.rma" object. By default, \(\tau^2\) is shown on the y-axis for a random-effects model and \(I^2\) otherwise, but one can also use argument yaxis to specify the measure of heterogeneity to place on the y-axis.
The color gradient of the points/lines indicates the order of the cumulative results (by default, light gray at the beginning, dark gray at the end). A different set of colors can be chosen via the cols argument. See ‘Examples’.
References
Viechtbauer, W. (2010). Conducting meta-analyses in R with the metafor package. Journal of Statistical Software, 36(3), 1–48. https://doi.org/10.18637/jss.v036.i03
See also
cumul for the function to conduct a cumulative meta-analysis.
Examples
### calculate log risk ratios and corresponding sampling variances
dat <- escalc(measure="RR", ai=tpos, bi=tneg, ci=cpos, di=cneg, data=dat.bcg)

### random-effects model
res <- rma(yi, vi, data=dat)

### cumulative meta-analysis (in the order of publication year)
sav <- cumul(res, order=year)

### plot of the pooled estimates and tau^2 over time
plot(sav)


### illustrate some other plot options
plot(sav, yaxis="I2", ylim=c(0,100), transf=exp, xlim=c(0.25,0.55),
     lwd=5, cex=1.5, cols=c("green","blue","red"))
### illustrate some other plot options
plot(sav, yaxis="I2", ylim=c(0,100), transf=exp, xlim=c(0.25,0.55),
lwd=5, cex=1.5, cols=c("green","blue","red"))