Studies on Antidepressants for the Primary Care Setting
dat.linde2016.RdResults from 93 trials examining 22 interventions (including placebo and usual care) for the primary care of depression.
dat.linde2016Format
The data frame contains the following columns:
| id | integer | study ID |
| author | character | first author |
| year | numeric | year of publication |
| resp | numeric | number of responders |
| n | numeric | number of patients |
| int | character | intervention label |
| int.long | character | intervention label (full name) |
Details
This dataset comes from a network meta-analysis of 22 treatments of depression in primary care (Linde et al., 2016), based on 93 trials (79 two-arm trials, 13 three-arm trials, and one four-arm trial). The primary outcome was response after treatment (yes/no), defined as a reduction from baseline by at least 50% on a depression scale. The dataset contains log odds ratios with standard errors for all pairwise comparisons.
The interventions comprised both medical and psychological treatments, also in combination, including placebo and usual care (UC) (Linde et al., 2016). Pharmacological interventions were tricyclic antidepressants (TCA), selective serotonin reuptake inhibitors (SSRI), serotonin-noradrenaline reuptake inhibitors (SNRI), noradrenaline reuptake inhibitors (NRI), low- dose serotonin (5-HT2) antagonists and reuptake inhibitors (low-dose SARI), noradrenergic and specific serotonergic agents (NaSSa), reversible inhibitors of monoaminoxidase A (rMAO-A), hypericum extracts, and an individualized drug. Psychological interventions were cognitive behavioral therapy (CBT; four forms: face-to-face CBT, remote therapist-led CBT, guided self-help CBT, and no or minimal contact CBT), face-to-face problem-solving therapy (PST), face-to-face interpersonal psychotherapy, face-to-face psychodynamic therapy, and “other face-to-face therapy”. Combination therapies were face-to-face CBT + SSRI, face-to-face PST + SSRI, and face-to-face interpersonal psychotherapy + SSRI.
The dataset was used as an example in Rücker et al. (2020) to illustrate component network meta-analysis using frequentist methods.
Source
Linde, K., Rücker, G., Schneider, A., & Kriston, L. (2016). Questionable assumptions hampered interpretation of a network meta-analysis of primary care depression treatments. Journal of Clinical Epidemiology, 71, 86–96. https://doi.org/10.1016/j.jclinepi.2015.10.010
References
Rücker, G., Petropoulou, M., & Schwarzer, G. (2020). Network meta-analysis of multicomponent interventions. Biometrical Journal, 62(3), 808–821. https://doi.org/10.1002/bimj.201800167
Concepts
medicine, psychology, psychiatry, odds ratios, network meta-analysis, component network meta-analysis
Examples
### Show results of first three studies (first study has three treatment arms)
head(dat.linde2016, 7)
#> id author year resp n int int.long
#> 1 1 Lecrubier 1997 60 78 SNRI SNRI
#> 2 1 Lecrubier 1997 48 76 Placebo Placebo
#> 3 1 Lecrubier 1997 49 75 TCA TCA
#> 4 2 Smit 2006 16 44 Face-to-face CBT Face-to-face CBT
#> 5 2 Smit 2006 19 72 UC UC
#> 6 4 Blashki 1971 20 35 TCA TCA
#> 7 4 Blashki 1971 8 23 Placebo Placebo
### Load netmeta package
suppressPackageStartupMessages(library(netmeta))
### Print odds ratios and confidence limits with two digits
oldset <- settings.meta(digits = 2)
### Define order of treatments in printouts and forest plots
trts <- c("SSRI", "Face-to-face CBT", "Face-to-face interpsy",
"Face-to-face PST", "Face-to-face CBT + SSRI",
"Face-to-face interpsy + SSRI", "Face-to-face PST + SSRI",
"Face-to-face psychodyn", "Other face-to-face",
"TCA", "SNRI", "NRI", "Low-dose SARI", "NaSSa", "rMAO-A", "Ind drug",
"Hypericum", "Remote CBT", "Self-help CBT", "No contact CBT", "UC",
"Placebo")
### Use pairwise() to transform data to comparison-based format
pw <- pairwise(treat = int,
event = resp, n = n,
studlab = paste(author, year),
data = dat.linde2016,
reference = "plac",
sm = "OR")
### Conduct random effects network meta-analysis
nma <- netmeta(pw, reference.group = "placebo",
seq = trts, common = FALSE)
### Network graph
netgraph(nma, seq = "o")
 ### Show results
nma
#> Number of studies: k = 93
#> Number of pairwise comparisons: m = 124
#> Number of observations: o = 20580
#> Number of treatments: n = 22
#> Number of designs: d = 40
#>
#> Random effects model
#>
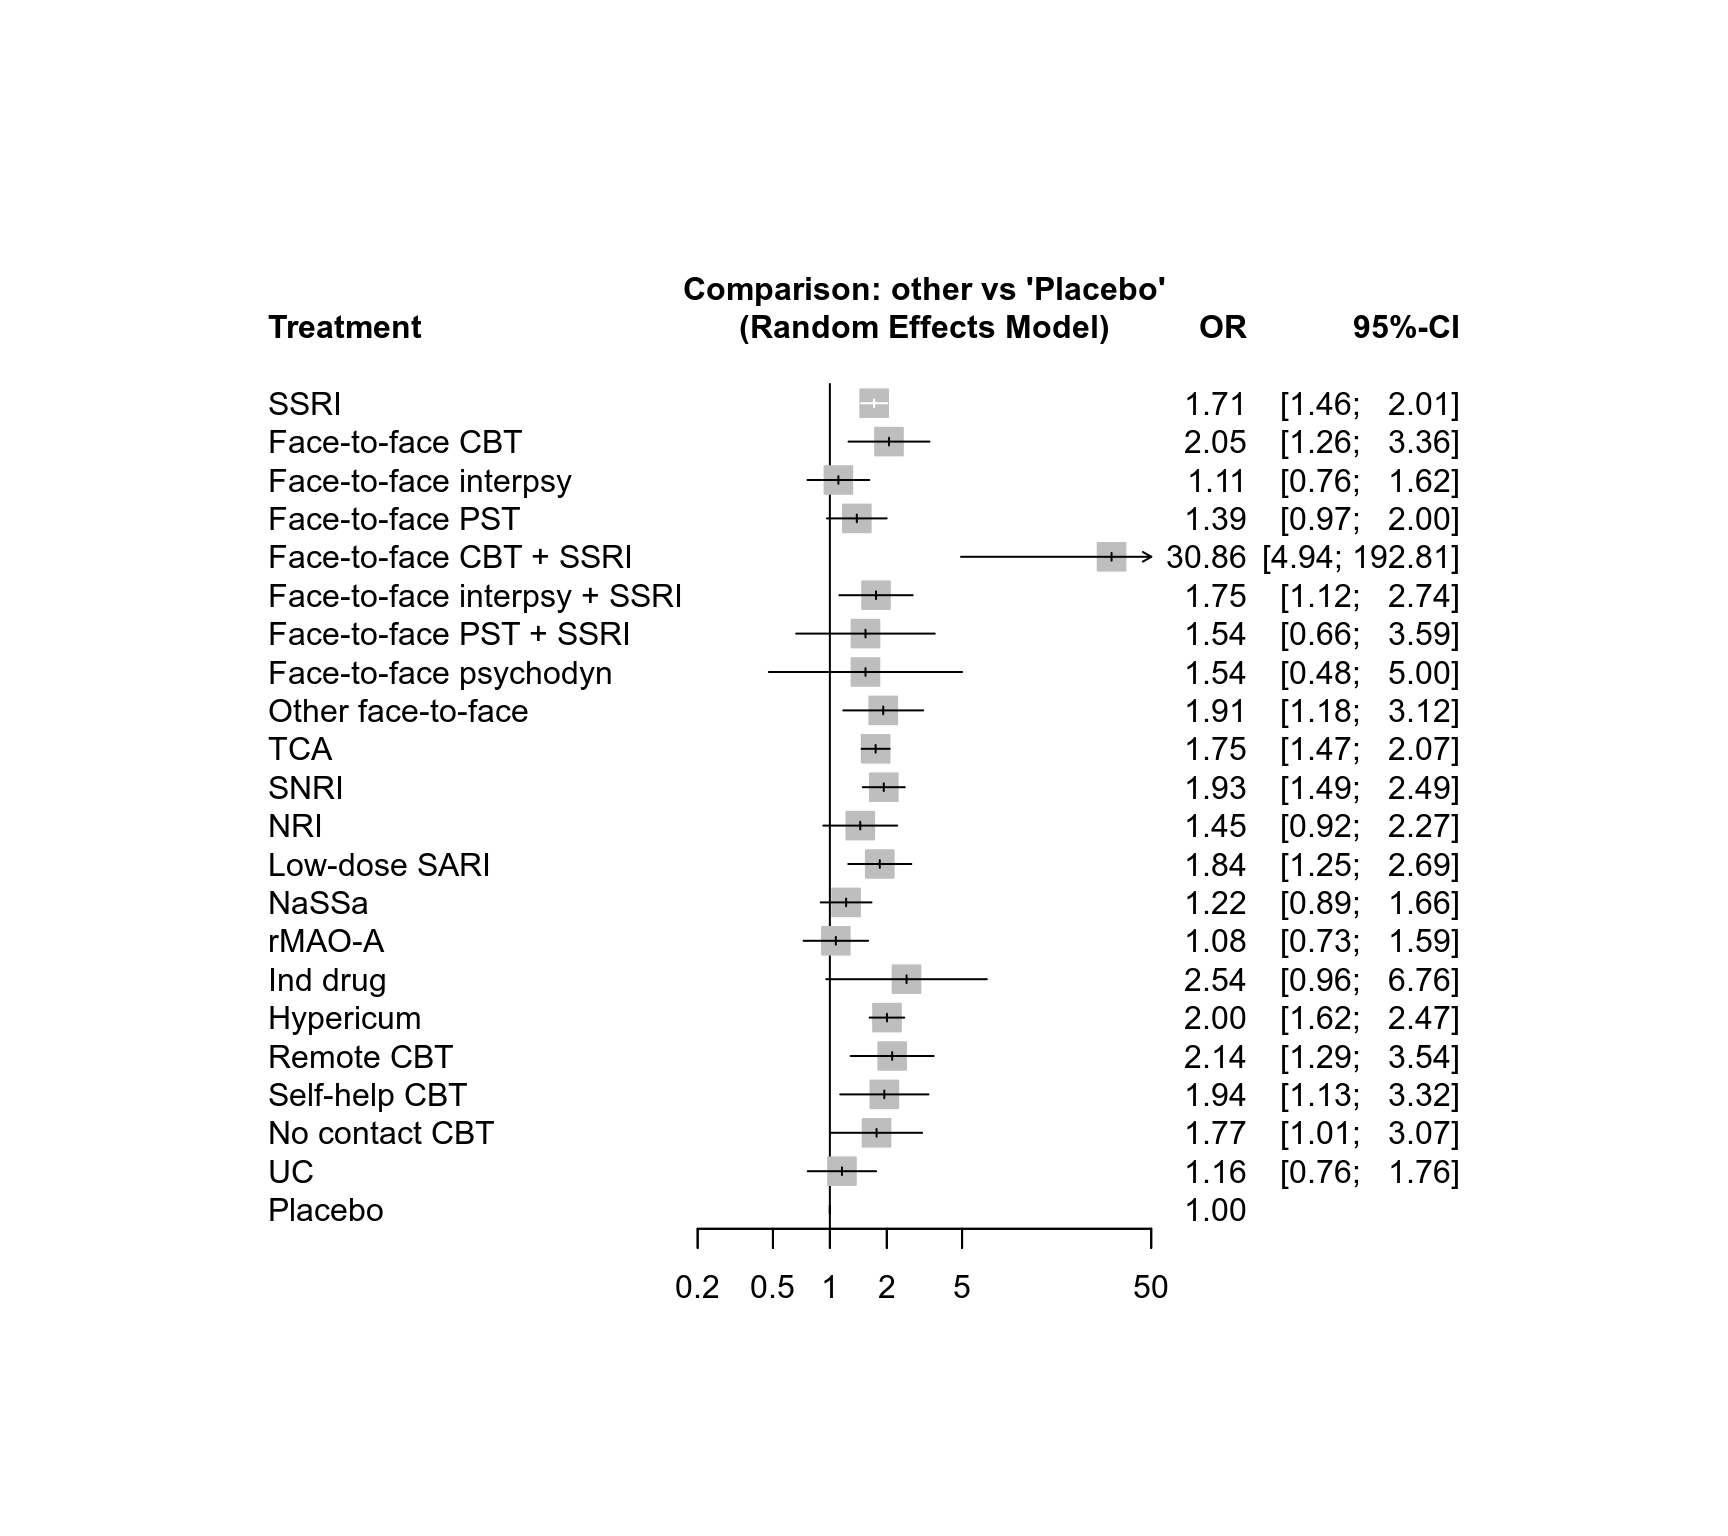
#> Treatment estimate (other treatments vs 'Placebo'):
#> OR 95% CI z p-value
#> SSRI 1.71 [1.46; 2.01] 6.61 < 0.0001
#> Face-to-face CBT 2.05 [1.26; 3.36] 2.86 0.0042
#> Face-to-face interpsy 1.11 [0.76; 1.62] 0.54 0.5897
#> Face-to-face PST 1.39 [0.97; 2.00] 1.77 0.0770
#> Face-to-face CBT + SSRI 30.86 [4.94; 192.81] 3.67 0.0002
#> Face-to-face interpsy + SSRI 1.75 [1.12; 2.74] 2.47 0.0135
#> Face-to-face PST + SSRI 1.54 [0.66; 3.59] 1.01 0.3136
#> Face-to-face psychodyn 1.54 [0.48; 5.00] 0.72 0.4700
#> Other face-to-face 1.91 [1.18; 3.12] 2.62 0.0089
#> TCA 1.75 [1.47; 2.07] 6.40 < 0.0001
#> SNRI 1.93 [1.49; 2.49] 5.04 < 0.0001
#> NRI 1.45 [0.92; 2.27] 1.61 0.1066
#> Low-dose SARI 1.84 [1.25; 2.69] 3.10 0.0019
#> NaSSa 1.22 [0.89; 1.66] 1.25 0.2102
#> rMAO-A 1.08 [0.73; 1.59] 0.36 0.7158
#> Ind drug 2.54 [0.96; 6.76] 1.87 0.0613
#> Hypericum 2.00 [1.62; 2.47] 6.48 < 0.0001
#> Remote CBT 2.14 [1.29; 3.54] 2.94 0.0033
#> Self-help CBT 1.94 [1.13; 3.32] 2.42 0.0156
#> No contact CBT 1.77 [1.01; 3.07] 2.01 0.0446
#> UC 1.16 [0.76; 1.76] 0.69 0.4882
#> Placebo . . . .
#>
#> Quantifying heterogeneity / inconsistency:
#> tau^2 = 0.0174; tau = 0.1319; I^2 = 15.1% [0.0%; 35.6%]
#>
#> Tests of heterogeneity (within designs) and inconsistency (between designs):
#> Q d.f. p-value
#> Total 102.45 87 0.1234
#> Within designs 58.07 54 0.3279
#> Between designs 44.38 33 0.0892
#>
#> Details of network meta-analysis methods:
#> - Frequentist graph-theoretical approach
#> - DerSimonian-Laird estimator for tau^2
#> - Calculation of I^2 based on Q
forest(nma, xlim = c(0.2, 50))
### Show results
nma
#> Number of studies: k = 93
#> Number of pairwise comparisons: m = 124
#> Number of observations: o = 20580
#> Number of treatments: n = 22
#> Number of designs: d = 40
#>
#> Random effects model
#>
#> Treatment estimate (other treatments vs 'Placebo'):
#> OR 95% CI z p-value
#> SSRI 1.71 [1.46; 2.01] 6.61 < 0.0001
#> Face-to-face CBT 2.05 [1.26; 3.36] 2.86 0.0042
#> Face-to-face interpsy 1.11 [0.76; 1.62] 0.54 0.5897
#> Face-to-face PST 1.39 [0.97; 2.00] 1.77 0.0770
#> Face-to-face CBT + SSRI 30.86 [4.94; 192.81] 3.67 0.0002
#> Face-to-face interpsy + SSRI 1.75 [1.12; 2.74] 2.47 0.0135
#> Face-to-face PST + SSRI 1.54 [0.66; 3.59] 1.01 0.3136
#> Face-to-face psychodyn 1.54 [0.48; 5.00] 0.72 0.4700
#> Other face-to-face 1.91 [1.18; 3.12] 2.62 0.0089
#> TCA 1.75 [1.47; 2.07] 6.40 < 0.0001
#> SNRI 1.93 [1.49; 2.49] 5.04 < 0.0001
#> NRI 1.45 [0.92; 2.27] 1.61 0.1066
#> Low-dose SARI 1.84 [1.25; 2.69] 3.10 0.0019
#> NaSSa 1.22 [0.89; 1.66] 1.25 0.2102
#> rMAO-A 1.08 [0.73; 1.59] 0.36 0.7158
#> Ind drug 2.54 [0.96; 6.76] 1.87 0.0613
#> Hypericum 2.00 [1.62; 2.47] 6.48 < 0.0001
#> Remote CBT 2.14 [1.29; 3.54] 2.94 0.0033
#> Self-help CBT 1.94 [1.13; 3.32] 2.42 0.0156
#> No contact CBT 1.77 [1.01; 3.07] 2.01 0.0446
#> UC 1.16 [0.76; 1.76] 0.69 0.4882
#> Placebo . . . .
#>
#> Quantifying heterogeneity / inconsistency:
#> tau^2 = 0.0174; tau = 0.1319; I^2 = 15.1% [0.0%; 35.6%]
#>
#> Tests of heterogeneity (within designs) and inconsistency (between designs):
#> Q d.f. p-value
#> Total 102.45 87 0.1234
#> Within designs 58.07 54 0.3279
#> Between designs 44.38 33 0.0892
#>
#> Details of network meta-analysis methods:
#> - Frequentist graph-theoretical approach
#> - DerSimonian-Laird estimator for tau^2
#> - Calculation of I^2 based on Q
forest(nma, xlim = c(0.2, 50))
 ### Additive component network meta-analysis with placebo as inactive treatment
cnma <- netcomb(nma, inactive = "placebo")
cnma
#> Number of studies: k = 93
#> Number of pairwise comparisons: m = 124
#> Number of treatments: n = 22
#> Number of active components: c = 18
#> Number of designs: d = 40
#>
#> Random effects model (inactive component: 'Placebo')
#>
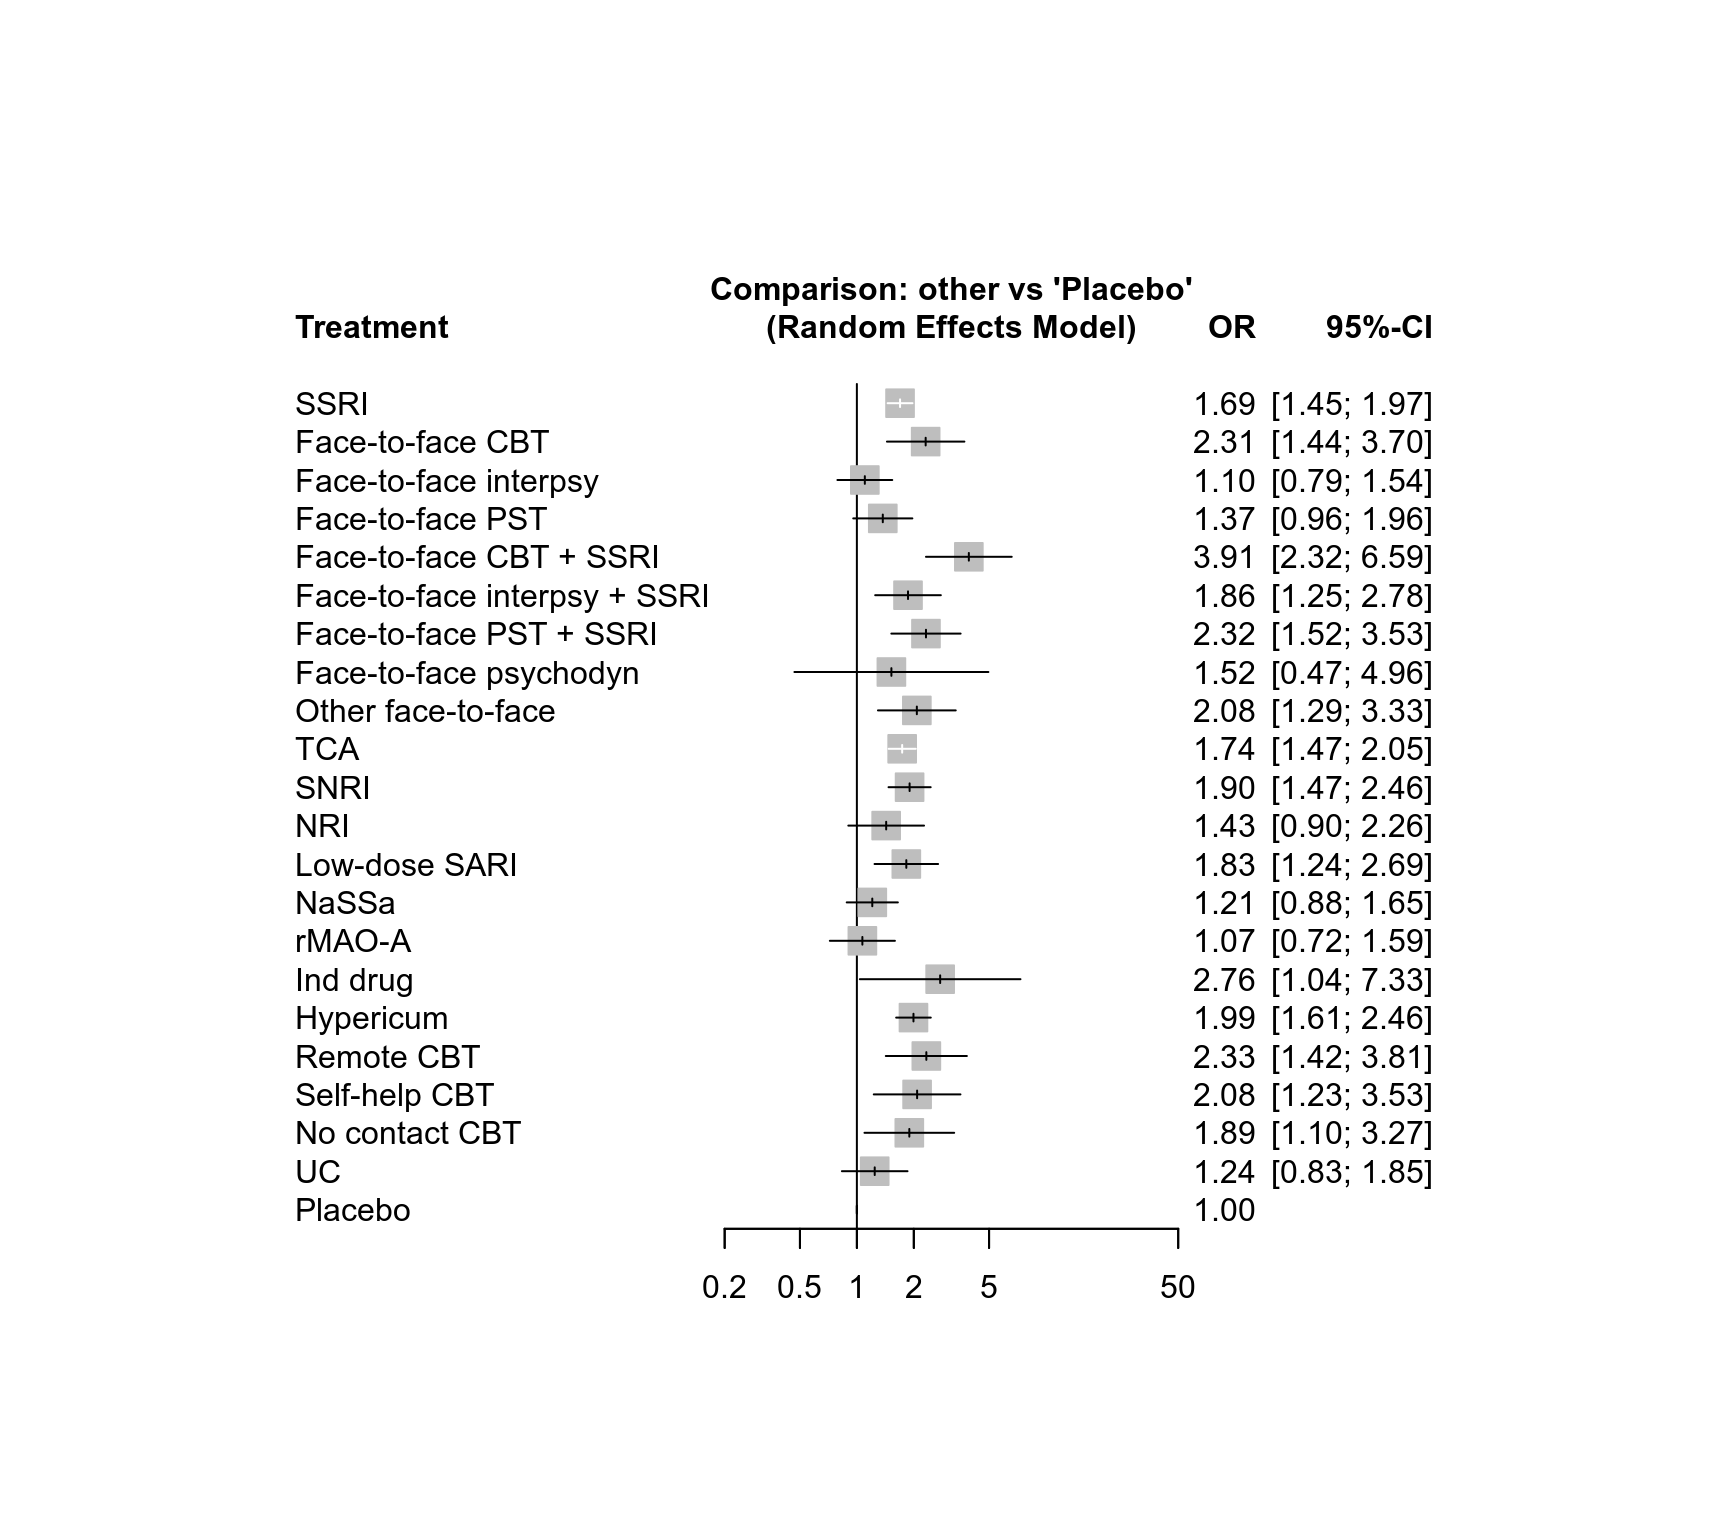
#> Treatment estimate (sm = 'OR', comparison: other treatments vs 'Placebo'):
#> OR 95% CI z p-value
#> SSRI 1.69 [1.45; 1.97] 6.81 < 0.0001
#> Face-to-face CBT 2.31 [1.44; 3.70] 3.48 0.0005
#> Face-to-face interpsy 1.10 [0.79; 1.54] 0.57 0.5693
#> Face-to-face PST 1.37 [0.96; 1.96] 1.72 0.0856
#> Face-to-face CBT + SSRI 3.91 [2.32; 6.59] 5.12 < 0.0001
#> Face-to-face interpsy + SSRI 1.86 [1.25; 2.78] 3.05 0.0023
#> Face-to-face PST + SSRI 2.32 [1.52; 3.53] 3.91 < 0.0001
#> Face-to-face psychodyn 1.52 [0.47; 4.96] 0.70 0.4853
#> Other face-to-face 2.08 [1.29; 3.33] 3.02 0.0025
#> TCA 1.74 [1.47; 2.05] 6.53 < 0.0001
#> SNRI 1.90 [1.47; 2.46] 4.91 < 0.0001
#> NRI 1.43 [0.90; 2.26] 1.52 0.1291
#> Low-dose SARI 1.83 [1.24; 2.69] 3.05 0.0023
#> NaSSa 1.21 [0.88; 1.65] 1.18 0.2371
#> rMAO-A 1.07 [0.72; 1.59] 0.33 0.7399
#> Ind drug 2.76 [1.04; 7.33] 2.03 0.0420
#> Hypericum 1.99 [1.61; 2.46] 6.41 < 0.0001
#> Remote CBT 2.33 [1.42; 3.81] 3.36 0.0008
#> Self-help CBT 2.08 [1.23; 3.53] 2.72 0.0064
#> No contact CBT 1.89 [1.10; 3.27] 2.29 0.0219
#> UC 1.24 [0.83; 1.85] 1.07 0.2862
#> Placebo . . . .
#>
#> Incremental effect for existing combinations:
#> iOR 95% CI z p-value
#> Face-to-face CBT + SSRI 3.91 [2.32; 6.59] 5.12 < 0.0001
#> Face-to-face PST + SSRI 2.32 [1.52; 3.53] 3.91 < 0.0001
#> Face-to-face interpsy + SSRI 1.86 [1.25; 2.78] 3.05 0.0023
#>
#> Incremental effect for components:
#> iOR 95% CI z p-value
#> Face-to-face CBT 2.31 [1.44; 3.70] 3.48 0.0005
#> Face-to-face PST 1.37 [0.96; 1.96] 1.72 0.0856
#> Face-to-face interpsy 1.10 [0.79; 1.54] 0.57 0.5693
#> Face-to-face psychodyn 1.52 [0.47; 4.96] 0.70 0.4853
#> Hypericum 1.99 [1.61; 2.46] 6.41 < 0.0001
#> Ind drug 2.76 [1.04; 7.33] 2.03 0.0420
#> Low-dose SARI 1.83 [1.24; 2.69] 3.05 0.0023
#> NRI 1.43 [0.90; 2.26] 1.52 0.1291
#> NaSSa 1.21 [0.88; 1.65] 1.18 0.2371
#> No contact CBT 1.89 [1.10; 3.27] 2.29 0.0219
#> Other face-to-face 2.08 [1.29; 3.33] 3.02 0.0025
#> Remote CBT 2.33 [1.42; 3.81] 3.36 0.0008
#> SNRI 1.90 [1.47; 2.46] 4.91 < 0.0001
#> SSRI 1.69 [1.45; 1.97] 6.81 < 0.0001
#> Self-help CBT 2.08 [1.23; 3.53] 2.72 0.0064
#> TCA 1.74 [1.47; 2.05] 6.53 < 0.0001
#> UC 1.24 [0.83; 1.85] 1.07 0.2862
#> rMAO-A 1.07 [0.72; 1.59] 0.33 0.7399
#>
#> Quantifying heterogeneity / inconsistency:
#> tau^2 = 0.0208; tau = 0.1441; I^2 = 17.5% [0.0%; 37.1%]
#>
#> Heterogeneity statistics:
#> Q df p-value
#> Additive model 109.12 90 0.0832
#> Standard model 102.45 87 0.1234
#> Difference 6.67 3 0.0831
#>
#> Details of network meta-analysis methods:
#> - Frequentist graph-theoretical approach
#> - Component network meta-analysis
#> - DerSimonian-Laird estimator for tau^2
#> - Calculation of I^2 based on Q
forest(cnma, xlim = c(0.2, 50))
### Additive component network meta-analysis with placebo as inactive treatment
cnma <- netcomb(nma, inactive = "placebo")
cnma
#> Number of studies: k = 93
#> Number of pairwise comparisons: m = 124
#> Number of treatments: n = 22
#> Number of active components: c = 18
#> Number of designs: d = 40
#>
#> Random effects model (inactive component: 'Placebo')
#>
#> Treatment estimate (sm = 'OR', comparison: other treatments vs 'Placebo'):
#> OR 95% CI z p-value
#> SSRI 1.69 [1.45; 1.97] 6.81 < 0.0001
#> Face-to-face CBT 2.31 [1.44; 3.70] 3.48 0.0005
#> Face-to-face interpsy 1.10 [0.79; 1.54] 0.57 0.5693
#> Face-to-face PST 1.37 [0.96; 1.96] 1.72 0.0856
#> Face-to-face CBT + SSRI 3.91 [2.32; 6.59] 5.12 < 0.0001
#> Face-to-face interpsy + SSRI 1.86 [1.25; 2.78] 3.05 0.0023
#> Face-to-face PST + SSRI 2.32 [1.52; 3.53] 3.91 < 0.0001
#> Face-to-face psychodyn 1.52 [0.47; 4.96] 0.70 0.4853
#> Other face-to-face 2.08 [1.29; 3.33] 3.02 0.0025
#> TCA 1.74 [1.47; 2.05] 6.53 < 0.0001
#> SNRI 1.90 [1.47; 2.46] 4.91 < 0.0001
#> NRI 1.43 [0.90; 2.26] 1.52 0.1291
#> Low-dose SARI 1.83 [1.24; 2.69] 3.05 0.0023
#> NaSSa 1.21 [0.88; 1.65] 1.18 0.2371
#> rMAO-A 1.07 [0.72; 1.59] 0.33 0.7399
#> Ind drug 2.76 [1.04; 7.33] 2.03 0.0420
#> Hypericum 1.99 [1.61; 2.46] 6.41 < 0.0001
#> Remote CBT 2.33 [1.42; 3.81] 3.36 0.0008
#> Self-help CBT 2.08 [1.23; 3.53] 2.72 0.0064
#> No contact CBT 1.89 [1.10; 3.27] 2.29 0.0219
#> UC 1.24 [0.83; 1.85] 1.07 0.2862
#> Placebo . . . .
#>
#> Incremental effect for existing combinations:
#> iOR 95% CI z p-value
#> Face-to-face CBT + SSRI 3.91 [2.32; 6.59] 5.12 < 0.0001
#> Face-to-face PST + SSRI 2.32 [1.52; 3.53] 3.91 < 0.0001
#> Face-to-face interpsy + SSRI 1.86 [1.25; 2.78] 3.05 0.0023
#>
#> Incremental effect for components:
#> iOR 95% CI z p-value
#> Face-to-face CBT 2.31 [1.44; 3.70] 3.48 0.0005
#> Face-to-face PST 1.37 [0.96; 1.96] 1.72 0.0856
#> Face-to-face interpsy 1.10 [0.79; 1.54] 0.57 0.5693
#> Face-to-face psychodyn 1.52 [0.47; 4.96] 0.70 0.4853
#> Hypericum 1.99 [1.61; 2.46] 6.41 < 0.0001
#> Ind drug 2.76 [1.04; 7.33] 2.03 0.0420
#> Low-dose SARI 1.83 [1.24; 2.69] 3.05 0.0023
#> NRI 1.43 [0.90; 2.26] 1.52 0.1291
#> NaSSa 1.21 [0.88; 1.65] 1.18 0.2371
#> No contact CBT 1.89 [1.10; 3.27] 2.29 0.0219
#> Other face-to-face 2.08 [1.29; 3.33] 3.02 0.0025
#> Remote CBT 2.33 [1.42; 3.81] 3.36 0.0008
#> SNRI 1.90 [1.47; 2.46] 4.91 < 0.0001
#> SSRI 1.69 [1.45; 1.97] 6.81 < 0.0001
#> Self-help CBT 2.08 [1.23; 3.53] 2.72 0.0064
#> TCA 1.74 [1.47; 2.05] 6.53 < 0.0001
#> UC 1.24 [0.83; 1.85] 1.07 0.2862
#> rMAO-A 1.07 [0.72; 1.59] 0.33 0.7399
#>
#> Quantifying heterogeneity / inconsistency:
#> tau^2 = 0.0208; tau = 0.1441; I^2 = 17.5% [0.0%; 37.1%]
#>
#> Heterogeneity statistics:
#> Q df p-value
#> Additive model 109.12 90 0.0832
#> Standard model 102.45 87 0.1234
#> Difference 6.67 3 0.0831
#>
#> Details of network meta-analysis methods:
#> - Frequentist graph-theoretical approach
#> - Component network meta-analysis
#> - DerSimonian-Laird estimator for tau^2
#> - Calculation of I^2 based on Q
forest(cnma, xlim = c(0.2, 50))
 ### Use previous settings
settings.meta(oldset)
### Use previous settings
settings.meta(oldset)