Studies on the Prevalence of Depression After Myocardial Infarction
dat.feng2019.RdResults from 19 studies assessing the prevalence of depression after myocardial infarction
dat.feng2019Format
The data frame contains the following columns:
| author | character | first author |
| year | integer | publication year |
| region | character | country |
| design | character | study design |
| source | character | sample source |
| age | numeric | mean age |
| males | numeric | percentage of males |
| first | numeric | percentage of first-time MI |
| questionnaire | character | self-report questionnaire |
| interview | character | structured interview |
| timing | character | timing of depression assessment |
| depr | integer | subjects with depression |
| n | integer | sample size |
Details
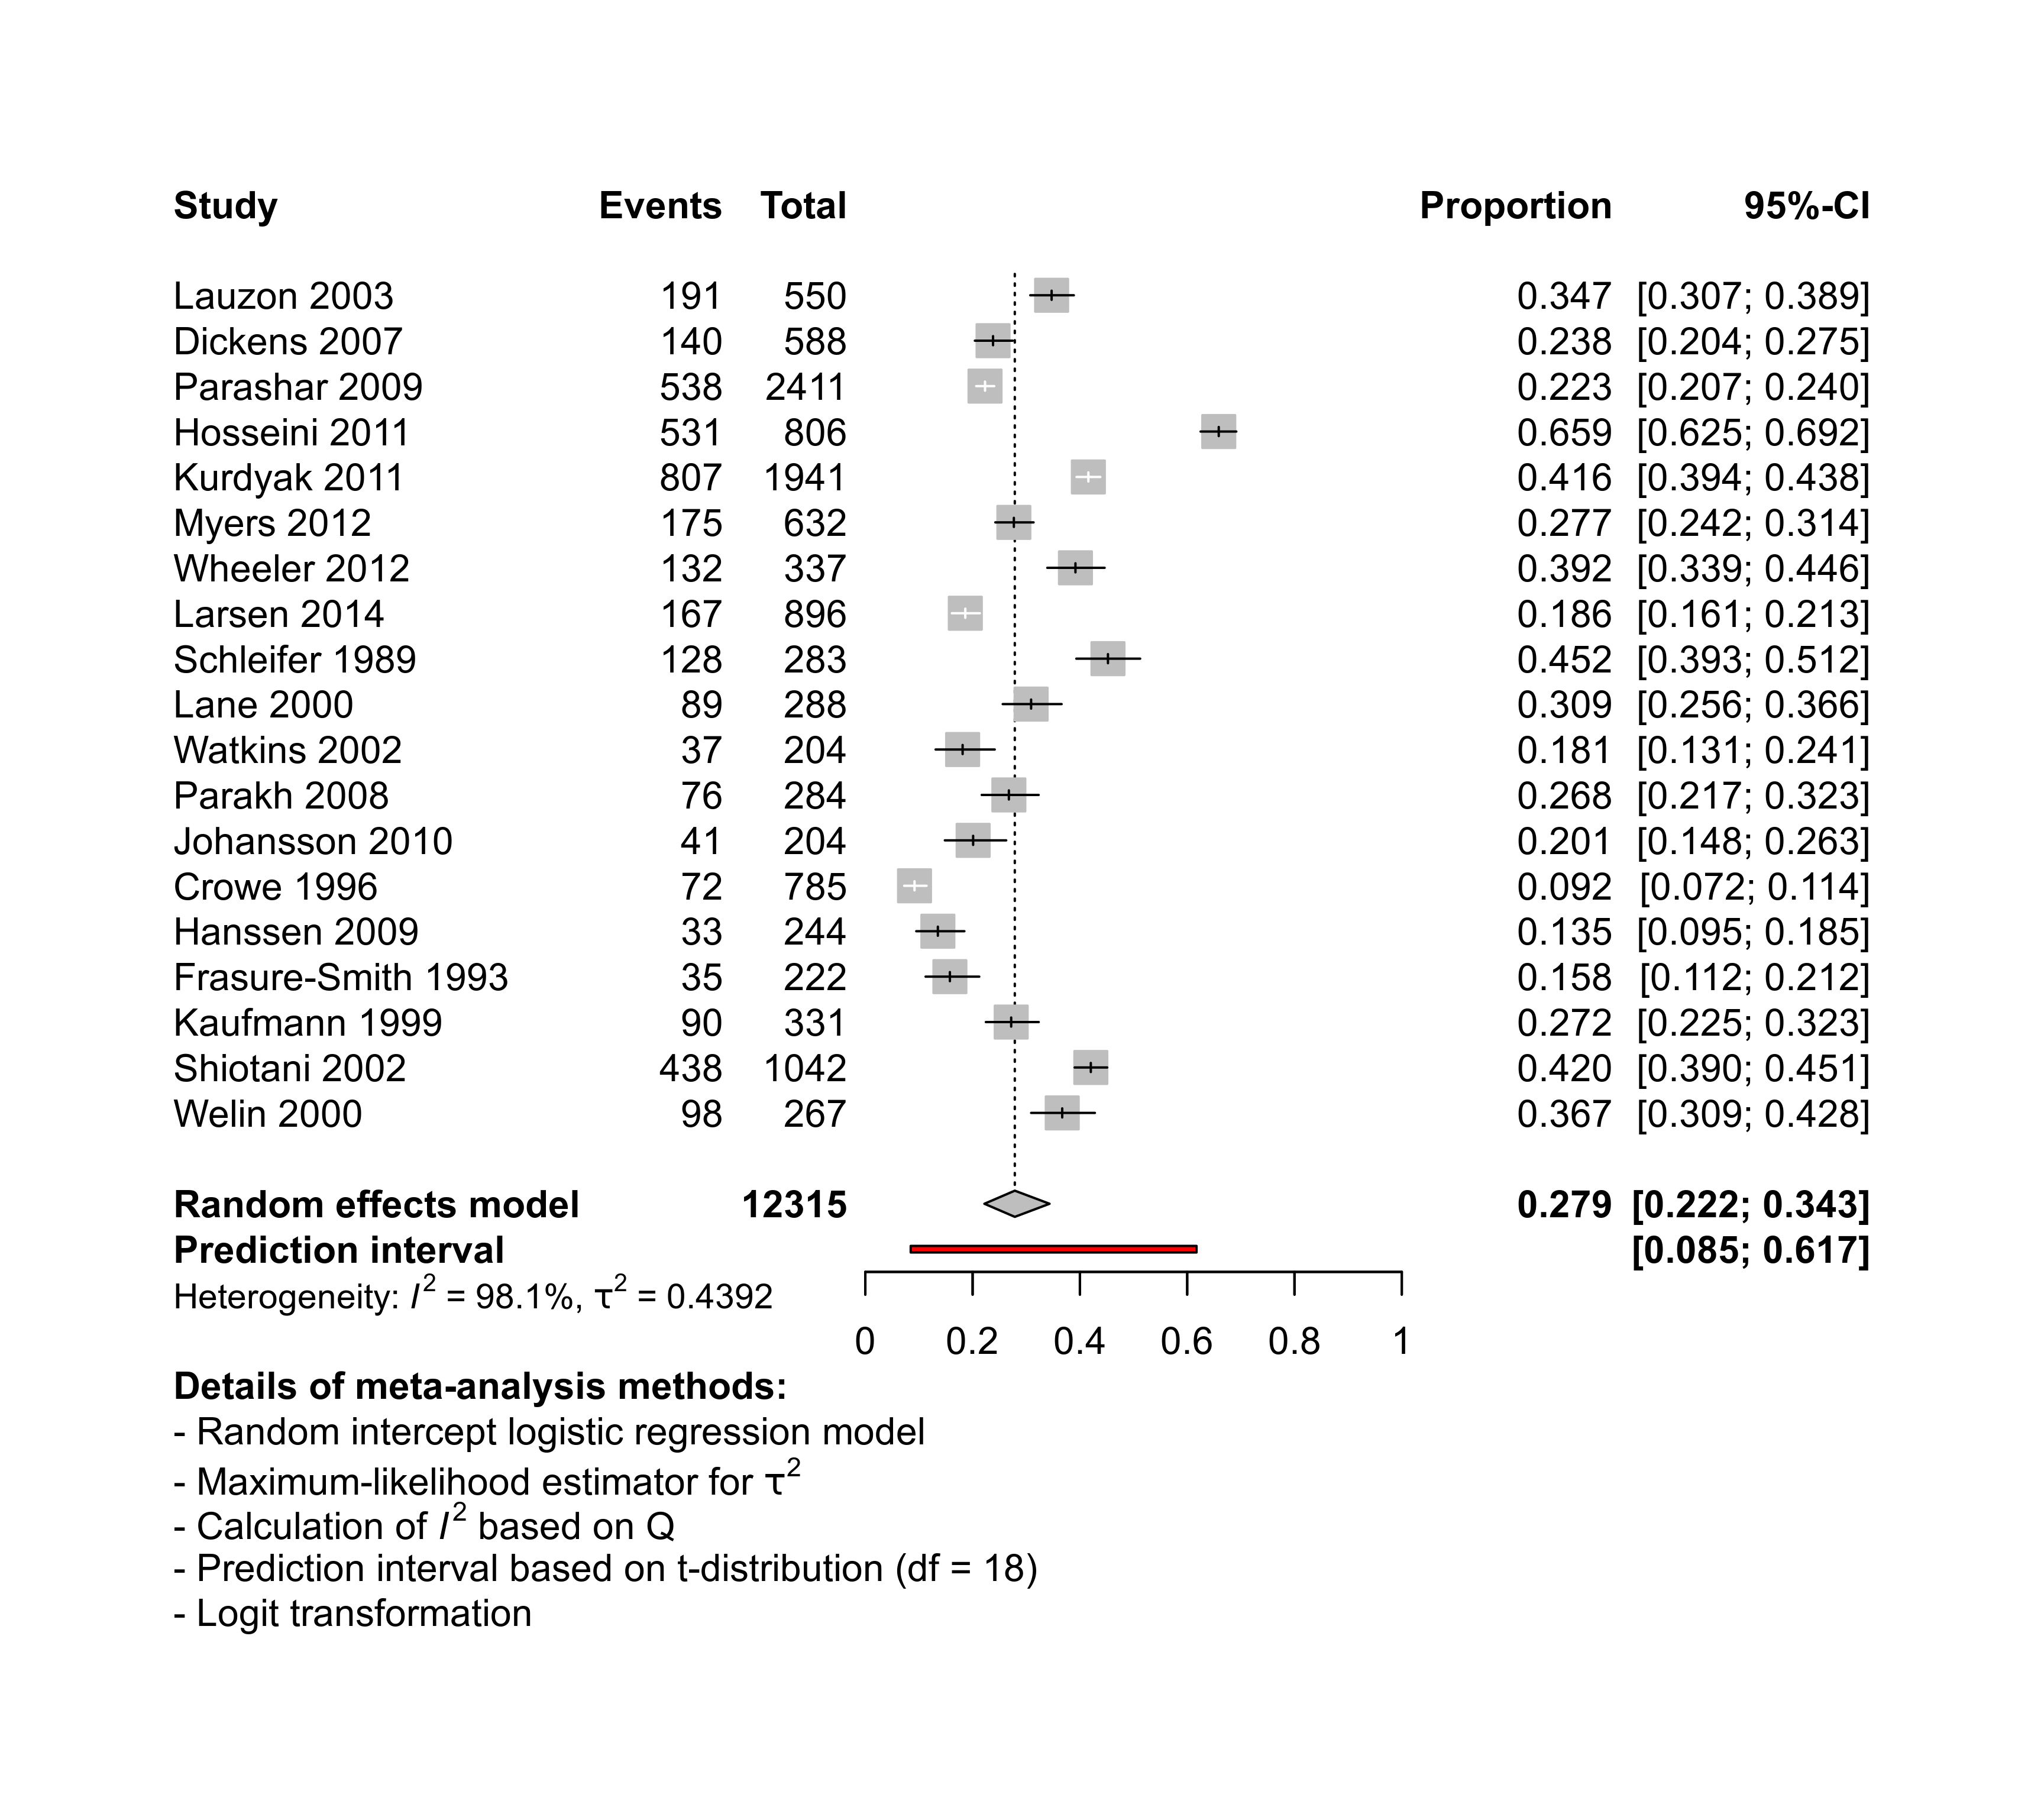
This data set comes from a meta-analysis with 19 studies to estimate the prevalence of depression after a myocardial infarction. The variables depr and n contain the number of depressive patients and the total number of patients.
Source
Feng, L., Li, L., Liu, W., Yang, J., Wang, Q., Shi, L., & Luo, M. (2019). Prevalence of depression in myocardial infarction: A PRISMA-compliant meta-analysis. Medicine, 98(8), e14596. https://doi.org/10.1097/md.0000000000014596
Concepts
psychology, cardiology, prevalence
Examples
### Show results of first six studies
head(dat.feng2019)
#>     author year region       design         source  age males first questionnaire interview
#> 1   Lauzon 2003 Canada Longitudinal Hospital-based 60.0  78.9  79.1        BDI≥10      <NA>
#> 2  Dickens 2007     UK Longitudinal Hospital-based 60.0  70.4  84.0       HADS≥17      <NA>
#> 3 Parashar 2009    USA Longitudinal Hospital-based 60.5  66.5  78.9      PHQ-9≥10      <NA>
#> 4 Hosseini 2011   Iran Longitudinal Hospital-based 58.0  69.0  86.9        BDI≥10      <NA>
#> 5  Kurdyak 2011 Canada Longitudinal Hospital-based 62.4  70.4    NA       BCDRS≥4      <NA>
#> 6    Myers 2012 Israel Longitudinal Hospital-based 52.3  86.0  88.0        BDI≥10      <NA>
#>        timing depr    n
#> 1    2-3 days  191  550
#> 2    3.6 days  140  588
#> 3 24-72 hours  538 2411
#> 4     15 days  531  806
#> 5     30 days  807 1941
#> 6      1 week  175  632

### Load meta package
suppressPackageStartupMessages(library(meta))

### Conduct random effects meta-analysis
mp1 <- metaprop(depr, n, data = dat.feng2019,
  studlab = paste(author, year),
  common = FALSE, prediction = TRUE)

### Create forest plot
forest(mp1, digits = 3, xlim = c(0, 1),
  print.pval.Q = FALSE, details = TRUE)